Stochastic Oscillator
- Stochastic oscillator was created by Dr.George Lane.
Stochastic oscillator is a momentum indicator that shows the location of the current closing price of security relative to the high/low range over a set periods.
Stochastic oscillator is considered to be the same as RSI since both of them operate on the basis of oversold and overbought based on below or above certain range value.The only difference is that stochastic is further based on crossover.
Since stochastic oscillator is based on crossover,it therefore has two crossover lines,the blue line(which is the stochastic oscillator) and the red dotted line which is the signal line.
Just like in RSI,stochastic oscillator oscillates between 0 to 100.
Stochastic oscillator has two component,that is;
%K and %D.
The stochastic oscillator is therefore calculated using the following formula;
%K = (C-L14 ) X 100
H14-L14
Where;
C = The most recent closing price;
L14 = The lowest price traded of the 14 previous trading sessions;
H14 = The highest price traded during the same 14-day period ;while
%K = The current value of stochastic indicator;
%K is sometimes referred to as the slow stochastic indicator since the fast stochastic indicator is mostly taken as %D which is given as ;
%D = 3-period moving average of %K
Since stochastic oscillator is an oscillator ranging from 0 to 100 and is based on the overbought and oversold in the market as well as the crossover with two crossover lines,the stochastic oscillator and the signal line,it therefore follows that trade signal are created between crossover of these two lines.
Therefore,when the stochastic oscillator crosses above the signal line at below 20,that will be an indication of an oversold market thus signaling the trader to close any sell position and open a buy position since the market will start moving upwards.On the other hand,when the stochastic oscillator crosses below the signal line at above 80,that will be an indication of an overbought market thus signaling the trader to close any buy position and open a sell position since the market will start moving downwards.This is indicated as from the candle sticks chart below;
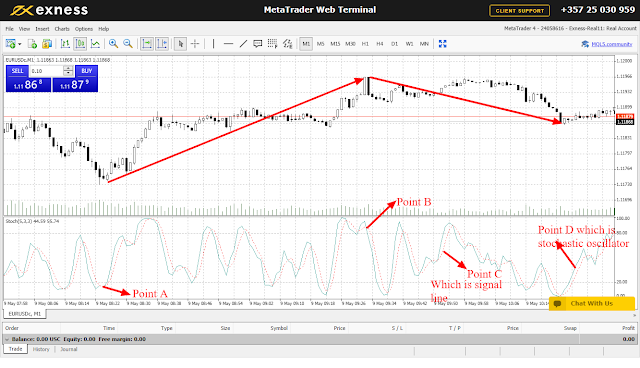
From the candle sticks chart above,there are 4 points,point A,B,C and D.Point A and B represent the crossover points while point C which is red dotted line is the signal line.Point D which is blue in color is the stochastic oscillator line.
At point A,the stochastic oscillator has crossed above the signal line at below 20 thus an indication of an oversold market at that point.This will signal the trader to close any sell position at point A and open a buy position since the market is starting to move upwards.
At point B,the stochastic oscillator has crossed below the signal line at above 80 thus an indication of an overbought market at that point.This will signal the trader to close any buy position at point B and open a sell position since the market is starting to move downwards.
Stochastic oscillator is a momentum indicator that shows the location of the current closing price of security relative to the high/low range over a set periods.
Stochastic oscillator is considered to be the same as RSI since both of them operate on the basis of oversold and overbought based on below or above certain range value.The only difference is that stochastic is further based on crossover.
Since stochastic oscillator is based on crossover,it therefore has two crossover lines,the blue line(which is the stochastic oscillator) and the red dotted line which is the signal line.
Just like in RSI,stochastic oscillator oscillates between 0 to 100.
Stochastic oscillator has two component,that is;
%K and %D.
The stochastic oscillator is therefore calculated using the following formula;
%K = (C-L14 ) X 100
H14-L14
C = The most recent closing price;
L14 = The lowest price traded of the 14 previous trading sessions;
H14 = The highest price traded during the same 14-day period ;while
%K = The current value of stochastic indicator;
%K is sometimes referred to as the slow stochastic indicator since the fast stochastic indicator is mostly taken as %D which is given as ;
%D = 3-period moving average of %K
Since stochastic oscillator is an oscillator ranging from 0 to 100 and is based on the overbought and oversold in the market as well as the crossover with two crossover lines,the stochastic oscillator and the signal line,it therefore follows that trade signal are created between crossover of these two lines.
Therefore,when the stochastic oscillator crosses above the signal line at below 20,that will be an indication of an oversold market thus signaling the trader to close any sell position and open a buy position since the market will start moving upwards.On the other hand,when the stochastic oscillator crosses below the signal line at above 80,that will be an indication of an overbought market thus signaling the trader to close any buy position and open a sell position since the market will start moving downwards.This is indicated as from the candle sticks chart below;

From the candle sticks chart above,there are 4 points,point A,B,C and D.Point A and B represent the crossover points while point C which is red dotted line is the signal line.Point D which is blue in color is the stochastic oscillator line.
At point A,the stochastic oscillator has crossed above the signal line at below 20 thus an indication of an oversold market at that point.This will signal the trader to close any sell position at point A and open a buy position since the market is starting to move upwards.
At point B,the stochastic oscillator has crossed below the signal line at above 80 thus an indication of an overbought market at that point.This will signal the trader to close any buy position at point B and open a sell position since the market is starting to move downwards.


Comments
Post a Comment