chande momentum oscillator(CMO)
Chande Momentum oscillator was created by Tushar Chande.
Chande momentum oscillator is normally used to capture the momentum of security.
Since it is an oscillator,it normally has an oscillation at point 0 ranging from -100 to 100.
Chande momentum oscillator is considered to be similar to Resistance Strength Index
Chande Momentum oscillator works on the basis of overbought and oversold as well as divergence
Chande momentum oscillator is therefore calculated using the following formulae;
Therefore,since chande momentum oscillator is based on divergence,it can therefore follows that when the market is moving downwards while the chande momentum oscillator curve is moving upwards,then the market will reverse and start moving upwards in the same direction as chande momentum oscillator.On the other hand,if the market is moving upwards while chande momentum oscillator is moving downwards,then the market will reverse and start moving downwards in the same direction as chande momentum oscillator.
Also,since chande momentum oscillator is based on overbought and oversold and it has an oscillation at point 0 ranging from -100 to 100,it therefore follows that when the chande momentum oscillator falls below -50,then that will be an indication of an oversold in the market thus signaling the trader to exit sell position and enter a buy position since the market will start moving upwards while when the chande momentum oscillator rises above +50,that will be an indication of an overbought in the market thus signaling the trader to exit any buy position and enter a sell position since the market will start moving downwards.
This is indicated as from the candle sticks chart below;
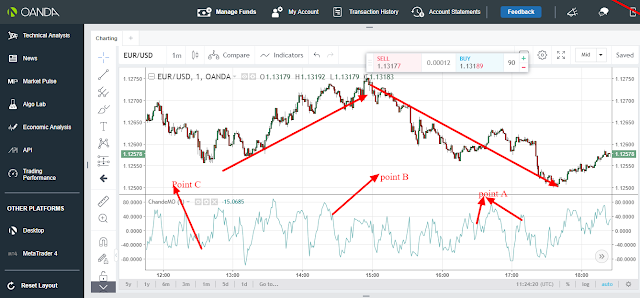
From the candle sticks chart above,there are 3 points,point A,B and C. Point A represents the chande momentum oscillator while point B and C represents points above 50 and below -50 respectively.
At point B,the chande momentum oscillator has risen above +50 thus an indication of an overbought market at that point. This will signal the trader to close any running buy position and open a sell position since the market will start moving downwards at that point.At point C,the chande momentum oscillator has fallen below -50 thus an indication of an oversold market at that point.This will signal the trader to close any sell position at that point and open a buy position since the market will start moving upwards.
Chande momentum oscillator is normally used to capture the momentum of security.
Since it is an oscillator,it normally has an oscillation at point 0 ranging from -100 to 100.
Chande momentum oscillator is considered to be similar to Resistance Strength Index
Chande Momentum oscillator works on the basis of overbought and oversold as well as divergence
Chande momentum oscillator is therefore calculated using the following formulae;
Chande momentum oscillator = (Sum of higher closes over a given period-sum of lower closes over given period)/(Sum of higher closes over a given period+sum of lower closes over a given period)
Therefore,since chande momentum oscillator is based on divergence,it can therefore follows that when the market is moving downwards while the chande momentum oscillator curve is moving upwards,then the market will reverse and start moving upwards in the same direction as chande momentum oscillator.On the other hand,if the market is moving upwards while chande momentum oscillator is moving downwards,then the market will reverse and start moving downwards in the same direction as chande momentum oscillator.Also,since chande momentum oscillator is based on overbought and oversold and it has an oscillation at point 0 ranging from -100 to 100,it therefore follows that when the chande momentum oscillator falls below -50,then that will be an indication of an oversold in the market thus signaling the trader to exit sell position and enter a buy position since the market will start moving upwards while when the chande momentum oscillator rises above +50,that will be an indication of an overbought in the market thus signaling the trader to exit any buy position and enter a sell position since the market will start moving downwards.
This is indicated as from the candle sticks chart below;

From the candle sticks chart above,there are 3 points,point A,B and C. Point A represents the chande momentum oscillator while point B and C represents points above 50 and below -50 respectively.
At point B,the chande momentum oscillator has risen above +50 thus an indication of an overbought market at that point. This will signal the trader to close any running buy position and open a sell position since the market will start moving downwards at that point.At point C,the chande momentum oscillator has fallen below -50 thus an indication of an oversold market at that point.This will signal the trader to close any sell position at that point and open a buy position since the market will start moving upwards.


Comments
Post a Comment