MACD(Moving Average Convergence Divergence
MACD indicator was created by Gerald appel.
MACD indicator is used to signal both the momentum and the trend of a security.
MACD is an oscillator and thus has an oscillation at point 0.
MACD indicator has 3 periods,that is 12,26 and 9.These three periods are the Exponential Moving Average .The difference between 12-period and 26-period represent the Exponential Moving Average of the MACD while 9 represent the signal line
Therefore,MACD is calculated using the following formula:
MACD= (EMA close 12)- (EMA close 26)
where as;
EMA is exponential moving average while;
MACD is moving average convergence divergence.
The oscillation point of the MACD indicator which is zero is the one that will have a straight base line.The curve line along this base line is the one that is the signal line and has a period of 9.The curve crossing above or below the signal line is the MACD curve and is the difference between the two EMA,that is 12-period EMA and 26 period EMA.When the MACD curve crosses above the signal line,that is an indication of an oversold market thus the trader should close any sell position and enter a buy position since the market will start moving upwards while when the MACD curve crosses below the signal line,that is an indication of an overbought market thus the trader should close any buy position and enter a sell position since the market will start moving downwards.This is indicated from the candle sticks chart below;

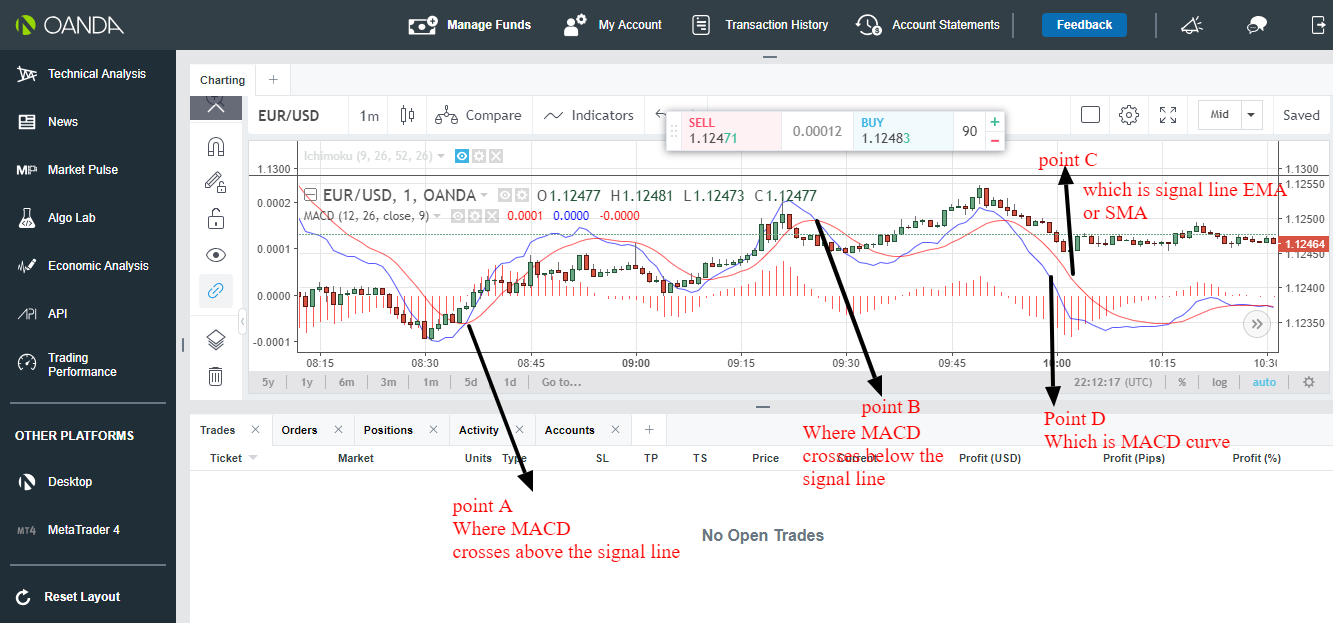
The candle sticks chart above represent the MACD(Moving Average Convergence Divergence)
The indicator has 4 points,that is point A,B,C and D indicated by the the black arrow.Point A represents the point at which the MACD curve crosses above the signal line.Point B represents the point at which the MACD curve crosses below the signal line.Point C represents the signal line EMA(Exponential Moving Average) and it has a period of 9 while point D represents the MACD cuve which is the difference between the 12 and 26 EMA periods.
From the candle sticks charts,at point A,the MACD curve crosses above the signal line thus an indication of an oversold market at that point.This will signal the trader to close any sell position at that point and enter a buy position since the market will start moving upwards .
At point B,the MACD curve crosses below the signal line thus an indication of an overbought market at that point.This will signal the trader to close any buy position at that point and enter a sell position since the market will start moving downwards
MACD indicator is used to signal both the momentum and the trend of a security.
MACD is an oscillator and thus has an oscillation at point 0.
MACD indicator has 3 periods,that is 12,26 and 9.These three periods are the Exponential Moving Average .The difference between 12-period and 26-period represent the Exponential Moving Average of the MACD while 9 represent the signal line
Therefore,MACD is calculated using the following formula:
MACD= (EMA close 12)- (EMA close 26)
where as;
EMA is exponential moving average while;
MACD is moving average convergence divergence.
The oscillation point of the MACD indicator which is zero is the one that will have a straight base line.The curve line along this base line is the one that is the signal line and has a period of 9.The curve crossing above or below the signal line is the MACD curve and is the difference between the two EMA,that is 12-period EMA and 26 period EMA.When the MACD curve crosses above the signal line,that is an indication of an oversold market thus the trader should close any sell position and enter a buy position since the market will start moving upwards while when the MACD curve crosses below the signal line,that is an indication of an overbought market thus the trader should close any buy position and enter a sell position since the market will start moving downwards.This is indicated from the candle sticks chart below;
The candle sticks chart above represent the MACD(Moving Average Convergence Divergence)
The indicator has 4 points,that is point A,B,C and D indicated by the the black arrow.Point A represents the point at which the MACD curve crosses above the signal line.Point B represents the point at which the MACD curve crosses below the signal line.Point C represents the signal line EMA(Exponential Moving Average) and it has a period of 9 while point D represents the MACD cuve which is the difference between the 12 and 26 EMA periods.
From the candle sticks charts,at point A,the MACD curve crosses above the signal line thus an indication of an oversold market at that point.This will signal the trader to close any sell position at that point and enter a buy position since the market will start moving upwards .
At point B,the MACD curve crosses below the signal line thus an indication of an overbought market at that point.This will signal the trader to close any buy position at that point and enter a sell position since the market will start moving downwards


Comments
Post a Comment