On Balance Volume
on balance volume indicator was created by Joseph Granville
on balance volume is a momentum trading indicator that uses volume flow to predict changes in security prices.
on balance volume is based on divergence and trend strategy and trend line strategy.
Based on trend and trend line strategy,the on balance volume will be considered to be on a rising trend when each new peak is higher than the previous peak and each new trough is higher than the previous trough.It will be considered to be on a falling trend when each new peak is lower than the previous peak and when each new trough is lower than the previous trough.
on balance volume is therefore calculated using the following formula;
-If the close price of the current bar is higher than the previous one,then the volume of current bar will be added to the previous one thus giving the formula as;
current period(OBV)=previous period(OBV) +current bar Volume
-if the close price of the current bar is lower than the previous one,then the volume of current bar will be subtracted from the previous one thus giving the formula as;
current period(OBV)= previous period(OBV)- current bar Volume.
Therefore,on the basis of divergence,when the price of the market is moving downwards when the On Balance Volume(OBV) is rising,then the market will be considered to be a bullish market thus the traders should close any sell position and open a buy position since the market will be moving upwards while when the market is moving upwards when the On Balance Volume (OBV) is falling,then the market will be considered to be a bearish market thus the traders should close any buy position and enter a sell position since the market will be moving downwards.This is indicated from the candle sticks chart below;
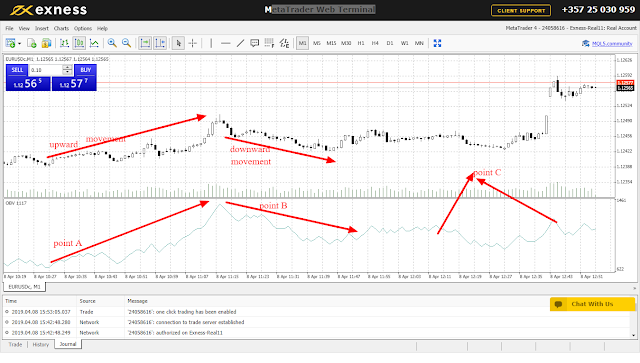
From the candle sticks chart above,there is point A,B and C.Point C is representing the OBV curve while point A and B is representing the upwards and downwards OBV movement.
At point A,the market was initially moving downwards while the OBV curve was rising.This results to an upward market reversal thus signaling the traders to close any sell position at that point and open a buy position because the market was becoming a bullish market.At point B,the market was initially moving upwards while the OBV curve was moving downwards.This resulted to a downward market reversal thus signaling the traders to close any buy position and open a sell position since the market was becoming a bearish market.


Comments
Post a Comment