Williams' Percentage Range(%R)
Williams' percentage range trading indicator was created by Larry Williams
Williams' percentage range indicator is a type of momentum indicator that moves between 0 and -100 and is used to tell the trader about the oversold and overbought of the market
Williams' percentage range indicator is calculated using the following formula;
%R= Highest High- Close/Highest High-Lowest Low
Since Williams' percentage range is an oscillator indicator and ranges between 0 to -100,it follows to have its oscillation at between -20 to -80.When the percentage range is below -80 then it is an indication that the market is oversold thus reversal of the market will take place thus the market will start moving upwards while when the percentage range is above -20 then it is an indication that the market is an overbought thus reversal of the market will take place thus the market will start moving downwards.Therefore,at below -80 where an upward market reversal will take place,the trader will be signaled to close any sell position and open a buy position since the market will be moving upwards while at above -20 where a downward market reversal will take place,the trader will be signaled to close any buy position and open a sell position since the market will be moving downwards.This is indicated as from the candle stick charts below;
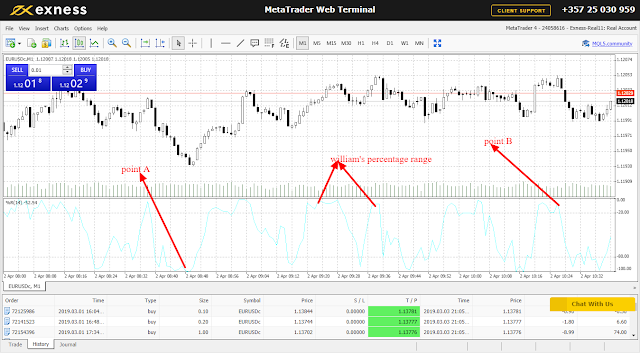
From the candle stick chart above,the two adjoining red arrows represent the williams' percentage range .Point A with the big red arrow represent percentage range below -80 while point B represent percentage range at above -20.Since point A is below -80,then it follows that an upward market reversal will take place since that point represent an oversold market.This will signal the trader to close any sell position position and open a buy position since the market will start moving upwards.
On the other hand,since point B is above -20,then it follows that a downward market reversal will take place since that point represent an overbought market.This will signal the trader to close any buy position and open a sell position since the market will start moving downwards.


Comments
Post a Comment