Moving Average Weight (WMA)
Moving average weight is a trend following indicator.
Since moving average weight is a trend following indicator, it is therefore used to indicate the direction of the market, that is whether the market is trending upwards or downwards.
Moving average weight normally places more weight on recent price and less weight on previous price.
Moving average weight is considered to be more significance than simple moving average since it follows direction of the market more closely as compared to simple moving average.
Moving average weight is based on bullish and bearish market as well as support and resistance
Moving average weight normally gives the weight average of the last price with a decreasing order thus the formula is derived as follows;
Let say that the last weight average price is n, then we will have
moving average weight = (P1*n)+(P2* n-1)+(P3* n-2)+(P4* n-3)/{(n)+(n-1)+(n-2)+(n-3)}
where P is the price and n is the weight average price.
Therefore, since moving average weight is based on bullish and bearish market, it therefore follows that when the market is in an upward trend, the moving average weight curve will also be trending upwards while when the market is in a downward trend, the moving average weight will also be trending downwards.
Therefore,if the moving average weight is moving upwards while the price is also moving upwards ,then the price rises above the moving average weight, that will be an indication that the market is about to start a downward trend thus signaling the trader to exit upward trend and enter a downward trend market.
On the other hand, if the moving average weight is moving downwards while the price is also moving downwards,then the price falls below the moving average weight, that will be an indication that the market is about to start an upward trend thus signaling the trader to exit downward trend and enter an upward trend.This is indicated as from the candle sticks chart below;
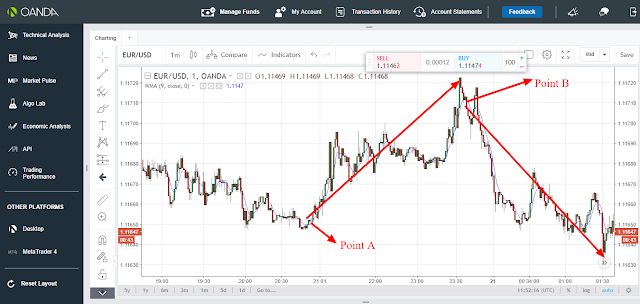
From the candle sticks chart above , the blue curve line represents the moving average weight .
There is also two points, A and B which represent support and resistance points.
At point A, the market and the moving average weight curve were initially moving downwards.The price then falls below the moving average weight thus reversing the market and the moving average weight to an upward market direction.This signals the trader to exit any downward position and open an upward position since the movement is starting upward trend as indicated by the arrow.
On the other hand , at point B, the market and the moving average weight curve were initially moving upwards.The price then rises above the moving average weight thus reversing the market and the moving average weight to a downwards market direction. This signals the trader to exit any upward position and open a downward position since the movement is starting a downward trend as indicated by the arrow.


Comments
Post a Comment