Posts

candle sticks chart

Image
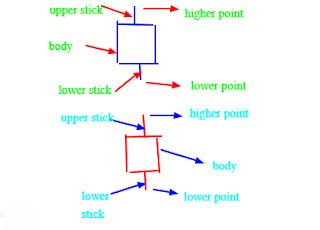
-A candlestick chart is a style of financial chart used to describe price movement of a security, derivative or currency.A candlestick is made up of a  body, an upper stick and a lower stick.It consits of two markets,a bear market and a bull market. In a candlestick chart, candlesticks do appear in two pairs of color,white and black or green and red.White and green indicates a bull market which means one should buy while red and black indicates a bear market which means one should sell. Here is how it looks like; -From the above image of the candle,the blue candle stick indicates a bull market while the red candlestick indicates a bear market.In a bull market,one is supposed enter a buy position while in a bear market one is supposed to enter a sell position.In both cases,there is high point and low point.In a bull market,one should enter the buy  market from the low point and close the market at the high point while the bear market,one should enter the market from the hi...

How to change the size of lot size on a metatrader

Image
After you have known on how to place a buy or a sell position,the next thing will be on how you can change the amount of unit or lot size to place in the market.Here is how to do it; -Between the sell and buy button,there is a white section with some numbers inside .Here is how it looks like.It is inside a yellow section -Inside it,there is two arrows,one pointing up and another pointing down.The arrow pointing up is used to increase the lot size while the one pointing down is used to decrease the lot size.Here is how it looks like.It is surrounded with a yellow mark -From the figure above,if you want to increase the lot size,then you will be required to click on the upward arrow while if you want to reduce the lot size then you will be required to click on the down arrow.

Bolinger bands

Image
Bollinger bands are charts indicator developed by John Bollinger and are used to measure the volatility of the market. The bollinger bands consists of three bands,that is; the center line band also referred to as simple moving average(SMA),the upper and the lower band which are also referred to as price channels. The center line band which is the simple moving average(SMA) is normally set at 20 period.The simple moving average is used because it uses the formula for standard deviation. The upper and lower bands which are based on volatility will widen(expand) when volatility of the market increases and narrow(contract) when volatility of the market decreases. According to John Bollinger,the bands should contain 88%-89% price action making the move outside band significant.To get the price action of the upper band,you add price action+(sdev*2) while to get the price action of lower band,you subtract price action-(sdev*2)  When the upper and lower band expand,it tells the trade...

Ichimoku kinko/cloud

Image
ichimoku kinko is a versatile indicator that defines support and resistance,identifies trend direction,gauges momentum and provides trading signal. The ichimoku cloud was created on  the basis of 3 periods,that is;9period,26period and 52periods.These periods can either be in terms of seconds,minutes,hours,days and months.It will be based on the time frame that one will choose to use.In most trading platform,these periods are on default thus one has the right to adjust them when they want to use them. The ichimoku cloud has got two pairs of colour,that is; red/black and green/white.The red/black indicates the bearing market while the green/white indicates the bullish market.The red/black cloud normally moves above the graph while the green/white clouds normally moves below the graph.When the red/black clouds are moving above the graph,that is an indication that the market will be moving downwards thus one should enter a sell position while if the white/green clouds are moving be...

Fibonacci Retracement

Image
Fibonacci retracement is a method of technical analysis for determining support and resistance.They are named after their use of Fibonacci sequences. Fibonacci sequence This is a series of numbers that is found by adding up two numbers before it.The sequence normally starts from zero. Here is the fibonacci sequence; 0,1,1,2,3,5,8,13,21,34,55,89,144,233,377........ etc -From the above fibonacci sequence,we can notice that the 1 is found by adding two numbers before it which are (0+1)  -The 2 is found by adding two numbers before it which are (1+1) -The 3 is found by adding two numbers before it which are (1+2) and so on. From the fibonacci sequence above,when you divide any two successive number,the second one divided by the first one,you will get what is  close to  golden ratio which is approximately to 1.618034. you will notice that as the pair becomes bigger,the approximation becomes very closer.This is illustrated as below A    ...

Forex Risk Management

Foreign exchange risk  describes the  risk  that an investment's value may change due to changes in the value of two different currencies. It is also known as currency  risk ,  FX risk  and exchange-rate  risk .Contingent exposure refers to the  risk  that firms face when they bid on projects in foreign currencies. In forex trading,risk management is very important for your success.You can be a very talented trader but without proper risk management,there is no where you are heading to.It will be like you are gambling since you will not be looking at your long term investment but instead at the jackpot.It will be like you are trying a lurk to win a big jackpot in a casino by placing your huge stake.Even in casino,it is statistically controlled.That is why when one person wins huge amount of money,the casino will still have made money from many people who will have lost.That is statistic because the casino favored that one person and unf...

scalping trading

Image
Scalping  is a  trading  style specializing in taking profits on small price changes, generally soon after a  trade  has been entered and has become profitable. It requires a  trader  to have a strict exit strategy, because one large loss could eliminate the many small gains the  trader  has worked to obtain.In scalping,if you want to make money at a very fast rate i would encourage you to use a 1minute time frame because it gives very accurate candlestick graph for scalping.Here is how a scalping diagram looks like and the best entry and exit point for scalping. It is a 1minute chart From the graph above,there are several sections for scalping.There is section AB,BC,CD,DE,EF,FG,GH AND HI.Section AB shows an upward trend of the market after which the market gains a downward trend from point B to C.At point B,there is a weak scalp thus one should not buy scalp the market at that point while at point C there is a strong scalp in the market t...