Posts

Showing posts from April, 2019

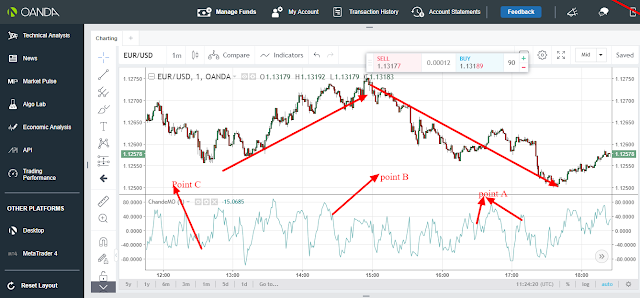
chaikin money flow(CMF)

Image
Chaikin money flow was created by Mark chaikin. Chaikin money flow is an indicator that is used to measure money flow volume over a given period of time. Chaikin money flow is an oscillator and therefore has an oscillation at point 0 ranging from -0.5 to 0.5. Chaikin money flow is based on centerline,overbought and oversold as well as divergence. Chaikin money flow is therefore calculated using the following steps; -calculating the money flow multiplier as follows; money flow multiplier= {(close-low)-(high-close)}/(high-low) -calculating the money flow volume as follows; money flow volume= money flow multiplier* volume of a given period -From the two results,the chaikin money flow is therefore calculated as follows; 21 period CMF= 21 period sum of money flow volume/21 period sum of volume Since chaikin money flow is based on centerline,it therefore follows that when the chaikin money flow crosses above 0 that will be an indication of a bullish market thus the tr

Elder's force index(EFI)

Image
Elder's force index indicator was created by Alexander Elder. Elder's force index is an indicator that is used to measure the power of bull or bear movement based on price and volume. Elder's force index price movement is based on three key components,namely; -Direction      - Extent          - Volume Elder's force index is an oscillator and therefore has an oscillation at point 0. Elder's force index is based on centerline and divergence. Elder's force index is therefore calculated using the following formula; Elder's force index= (Today's close - yesterday's close)* today's volume. Based on centerline,it therefore follows that when the Elder's force index rises above 0,that will be an indication of an upward trend market thus the traders should be trading upwards while when the elder's force index falls below 0 that will be an indication of a downward trend market thus the trader should be trading downwards. Also,b

Know Sure Thing(KST)

Image
Know Sure Thing indicator was created by Martin Pring. Know sure thing is a momentum oscillator that is based on smoothed rate of change and is used to measure price momentum with 4 different time frame. Know Sure Thing indicator is based on divergence,crossover and overbought and oversold in the market. Know Sure Thing is an oscillator and therefore has an oscillation at point 0. Know sure thing has two crossover lines,the blue line which represents the know sure thing(KST) and the red line which represents the signal line. Know sure thing is therefore calculated by following formula as below; -Taking the simple moving average(SMA) or rate of change (ROC) of four different period as follows ROCSMA1= 10 period SMA of 10 period ROC ROCSMA2= 10 period SMA of 15 period ROC ROCSMA3= 10 period SMA of 20 period ROC ROCSMA4 = 10 period SMA of 30 period ROC The four are then added together to give the know sure thing (KST) as follows; KST= (ROCSMA1*1)+(ROCSMA2*1)+(ROCS

rate of change(ROC)

Image
Rate Of Change indicator was created by Fred G Schutzman Rate of change is a momentum oscillator. Rate of change indicator is used to measure the percentage change in current price to that of the n period price. Rate of change is an oscillator and therefore has an oscillation at point 0.000 Rate of change indicator is based on divergence and overbought and oversold in the market. Rate of change indicator is therefore calculated using the following formula; Rate Of Change =( (current price/price of n periods ago)-1)*100 Since rate of change is an oscillator and has oscillation at point 0.000 and is based on oversold and overbought in the market,it therefore follows that when the ROC curve falls below -1 then that will be an indication that the market is moving downwards thus the traders should be trading downwards.When the ROC curve falls below -3,that will be an indication that the market has become oversold thus the trader should close any sell position and enter a buy

coppock curve

Image
Coppock curve indicator was created by Edwin Sedge Coppock. The coppock curve is a momentum indicator that was mainly created to determine the buy entry in the stock market.Beside buy entry for stock sell signal can also be identify though not recommended. Coppock curve has 3 period,that is 10 period,14 period and 11 period. Coppock curve is an momentum oscillator and therefore has an oscillation at point 0.0000. Coppock curve is therefore calculated using the following formula which is based on the 3 periods; Coppock curve =( WMA of 10period) of (14 period ROC+11period ROC) Where as; WMA is Weight Moving Average; ROC is Rate Of Change indicator; Since coppock curve has an oscillation at point 0,it therefore follows that when the coppock curve falls below 0.000 that will be an indication that the market has become an oversold market thus the trader should close any sell position and enter a buy position.On the other hand though not recommendable ,when the coppock curv

True strength index indicator

Image
True strength index  indicator was created by William Blau. True strength index  indicator is a momentum  oscillator that is used to show whether there is an overbought or oversold in the market. True strength index  indicator is based on crossover and therefore has two crossover lines,the red and the blue line.The red line indicates the signal line  while the blue line indicates the true strength indicator. True strength index  indicator has oscillation at point  0 ranging between -100 to 100. True strength index indicator is calculated using the following formula; True strength index indicator(TSI)=( DOUBLE SMOOTH PRICE CHANGE/DOUBLE SMOOTH ABSOLUTE PRICE CHANGE)*100 Since True strength index indicator is an oscillator and is based on crossover of the TRI above or below the signal line to indicate oversold and overbought in the market ,it therefore follows that when the True Strength index crosses above the signal line at below -25,that will be an indication of an oversold ma

vortex indicator(VI)

Image
Vortex indicator was created by Etienne Botes and Douglas Siepman. Vortex indicator is an oscillator used to identify the start of a new trend as well as the continuation of an existing trend in the market. The vortex indicator is composed of two curve lines,that is uptrend which is positive(+VI) and downtrend which is negative(-VI).The uptrend line is normally indicated using the blue/green line while the downtrend line is indicated using the red line. The vortex indicator is based on crossovers for oversold and overbought in the market. Vortex indicator is calculated using the following steps; -By calculating the positive and negative trend movements,that is of +VI and -VI based on previous high and low of current and previous periods as follows; +VM=current period high -previous period low -VM=current period low- previous period low +VM14 = 14 PERIOD sum of +VM   -VM14=14 PERIOD sum of -VM -By calculating the true range of the last 14 periods as follows; TR14

relative volatility index(RVI)

Image
Relative volatility index was developed by Donald Dorsey. Relative volatility index is used to indicate the direction of the volatility of the market Relative volatility index is considered to be similar to RSI except that it measures the standard deviation of price changes over a given period rather than the absolute price change. Relative volatility index is an oscillator and therefore it oscillates from 0 all the way to 100.It is based on overbought and oversold in the market. Relative volatility index is calculated the same way as Relative strength index except that instead of using price change,standard deviation of price change will be used in calculation Since relative volatility index is an oscillator,it therefore follows that when RVI rises above 50 that will tell the trader to be trading upwards while while RVI falls below 50 that will tell the trader to be trading downwards. Relative volatility index can also be used by a trader to know when to exit a market and en

ultimate oscillator

Image
Ultimate oscillator indicator was created by Larry Williams. Ultimate oscillator is an indicator that is used to measure the price of momentum across three time frame,that is,7,14 and 28. Ultimate oscillator indicator is based on divergence and oversold and overbought in the market. Since it is an oscillation,it can be seen oscillating from 20 to 80.When the divergence occurs when the ultimate oscillator curve falls below 30,that will be an indication of bullish market thus the trader should close any sell position and enter a buy position since the market will start moving upwards while when the divergence occurs when the ultimate oscillator curve rises above 70,that will be an indication of a bearish market thus the trader should close any buy position and enter a sell position since the market will start moving downwards.This is indicated as from the candle sticks chart below From the candle sticks chart above,there are 3 points,point A,B and C . Point C represents the ult

Aroon oscillator

Image
Aroon oscillator indicator was created by Tushar Chande. Aroon oscillator is an indicator used to determine whether there is a trend movement in the market or not. Aroon oscillator indicator is based on Aroon up and Aroon down lines.Aroon up is mostly indicated using blue line while Aroon down is mostly indicated using red line. Since Aroon oscillator indicator is an oscillator,it therefore has an oscillation at point 0 ranging from 0 to 100. Aroon oscillator has a period of 25. Aroon oscillator is calculated using the following formula; Aroon oscillator= Aroon up - Aroon down where as Aroon up = ((25-periods since 25 period high)/25)*100; Aroon down = ((25-periods since 25 period low)/25)*100; Since Aroon oscillator indicator is a trend oscillator with an oscillation at point 0 ranging between 0 to 100,it therefore follows that when Aroon(up) oscillator crosses aroon down above 0 then the trader should be trading upwards while when the Aroon(down) oscillator crosses a

chande momentum oscillator(CMO)

Image
Chande Momentum oscillator was created by Tushar Chande. Chande momentum oscillator is normally used to capture the momentum of security. Since it is an oscillator,it normally has an oscillation at point 0 ranging from -100 to 100. Chande momentum oscillator is considered to be similar to Resistance Strength Index Chande Momentum oscillator works on the basis of overbought and oversold as well as divergence Chande momentum oscillator is therefore calculated using the following formulae; Chande momentum oscillator = (Sum of higher closes over a given period-sum of lower closes over given period) / (Sum of higher closes over a given period+sum of lower closes over a given period) Therefore,since chande momentum oscillator is based on divergence,it can therefore follows that when the market is moving downwards while the chande momentum oscillator curve is moving upwards,then the market will reverse and start moving upwards in the same direction as chande momentum oscillator.On

chaikin oscillator

Image
Chaikin oscillator indicator was created by Mark Chaikin. Chaikin Oscillator is an oscillator indicator that is used to measure the momentum of the accumulation/distribution line of MACD(Moving Average Convergence Divergence). Since it is based on accumulation/distribution ,can therefore be considered to be on the basis of divergence(that is market price short moving in opposite direction to that of the chaikin oscillator curve) can also be considered to be on the basis of overbought/oversold market. Since chaikin oscillator is an oscillator,it therefore has an oscillation at point 0 ranging between -100 to +100. Chaikin oscillator is based on 3-period and 10-period. Using the 3-period and 10-period,Chaikin oscillator can therefore be  calculated using the following formula; -By subtracting the 10-period Exponential Moving Average of Accumulation/Distribution indicator from a 3 period exponential moving average of Accumulation/Distribution indicator thus we have; Chaikin Osc

Standard Deviation

Image
Standard deviation is a trend trading indicator that is used to measure the size of the recent price  move of a security thus predicting how volatile the price of security may be in the near future. standard deviation is considered to be part of bollinger band since both of them are based in volatility of the market. standard deviation is calculated using the following steps; -calculate the average price for the number of periods -determine the deviation of each calculated period -find the square of the deviation of each period -find the sum of the deviation of each square -divide the deviation sum by the number of  periods -square root the value gotten from above to get the standard deviation Since standard deviation is based on the volatility of the market,it therefore follows that when the value of the standard deviation is very high,that will be an indication of the market to have experience high volatility and this high volatility of the market may have start to decli

Accumulation swing index(ASI)

Image
ASI was created by Welles Wilder. The Accumulation Swing Index is a trend line trading indicator that is used to show the trader the direction of the market.That is,whether the market is moving upwards or downwards.Therefore,the trendline for ASI can be compared to the trend line drawn on the candle sticks chart. Accumulation swing index normally ranges between -100 to 100. The ASI indicator can be calculated by using its opening,closing,high and low prices. Since the ASI ranges between -100 to 100,it follows that when the ASI is trending from 0 towards 100,then that is an indication of an uptrend market thus the traders should be trading upward,while when the ASI is trending from 0 towards -100,then that is an indication of a downward trend market thus the trader should be trading downwards.This is indicated as from the candle sticks chart below; From the candle stick chart above,there are 3 points,point A,B and C. At point A,there are two arrows,one pointing downwards and

On Balance Volume

Image
on balance volume indicator was created by Joseph Granville on balance volume is a momentum trading indicator that uses volume flow to predict changes in security prices. on balance volume is based on divergence and trend strategy and trend line strategy. Based on trend and trend line strategy,the on balance volume will be considered to be on a rising trend when each new peak is higher than the previous peak and each new trough is higher than the previous trough.It will be considered to be on a falling trend when each new peak is lower than the previous peak and when each new trough is lower than the previous trough. on balance volume is therefore calculated using the following formula; -If the close price of the current bar is higher than the previous one,then the volume of current bar will be added to the previous one thus giving the formula as; current period(OBV)=previous period(OBV) +current bar Volume -if the close price of the current bar is lower than the previous o

Accumulation/Distribution

Image
Accumulation/Distribution indicator was created by Marc Chaikin. Accumulation means traders are buying while Distribution means traders are selling Accumulation/Distribution is a trading volume indicator that uses volume and price to access whether a stock is being accumulated(bought) or is being distributed(sold) Accumulation/distribution works on the basis of divergence,that is A/D moving in opposite direction to the price in the market after which price reverse. Accumulation/Distribution is calculated using the following formula; A/D= Previous A/D + Current money flow volume Since Accumulation/Distribution works on the basis of divergence,that is A/D moving in opposite direction to the price in the market.This is therefore to be said that when the A/D is moving downwards when the price in the market is rising,then a reversal of the price in the market will take place thus the price will also start moving downwards in the same direction as the A/D. On the other hand,when the

Money Flow Index(MFI)

Image
Money flow index trading  indicator was created by Gene Quong and Avrum Soudack. Money flow index is an oscillator that uses both price and volume for measuring the buying and selling preasure. Since it is an oscillator,it therefore follows to have oscillation ranges between 0 to 100 and oscillation points at 20 and 80 thus is considered to be similar to RSI.The only difference is that in Money flow index,volume is considered to be very important while in RSI,volume is not considered to be very important. Money Flow Index is calculated using the following formula; MFI=100-(100)/(1+MR) Where ; MR is money ratio given as; MR = POSITIVE MONEY FLOW/NEGATIVE MONEY FLOW Therefore,since money flow index is an oscillation ranging from 0 to 100 and oscillation points at 20 to 80 which make it similar to RSI,it therefore works on the basis of divergence and overbought and oversold in the market. For the case of divergence,when the price of the market is moving up while the MFI is fa

MACD(Moving Average Convergence Divergence

Image
MACD indicator  was created by Gerald appel. MACD indicator is used to signal both the momentum and the trend of a security. MACD is an oscillator and thus has an oscillation at point 0. MACD indicator has 3 periods,that is 12,26 and 9.These three periods are the Exponential Moving Average .The difference between 12-period and 26-period represent the Exponential Moving Average of the MACD while 9 represent the signal line Therefore,MACD is calculated using the following formula: MACD= (EMA close 12)- (EMA close 26) where as; EMA is exponential moving average while; MACD is moving average convergence divergence. The oscillation point of the MACD indicator which is zero is the one that will have a straight base line.The curve line along this base line is the one that is the signal line and has a period of 9.The curve crossing above or below the signal line is the MACD curve and is the difference between the two EMA,that is 12-period EMA and 26 period EMA.When the MACD curve

Williams' Percentage Range(%R)

Image
Williams' percentage range trading indicator was created by Larry Williams Williams' percentage range indicator is a type of momentum indicator that moves between 0 and -100 and is used to tell the trader about the oversold and overbought of the market Williams' percentage range indicator is calculated using the following formula; %R= Highest High- Close/Highest High-Lowest Low Since Williams' percentage range is an oscillator indicator and ranges between 0 to -100,it follows to have its oscillation at between -20 to -80.When the percentage range is below -80 then it is an indication that the market is  oversold thus reversal of the market will take place thus the market will start moving upwards while when the percentage range is above -20 then it is an indication that the market is an overbought thus reversal of the market will take place thus the market will start moving downwards.Therefore,at below -80 where an upward market reversal will take place,the trader

Momentum

Image
Momentum trading indicator was created by Carl Swenlin. Momentum trading indicator is an oscillator indicator that is used to measure the change of price of a financial instrument over a given time. Momentum trading indicator is calculated using the following formula; MOMENTUM=CURRENT CLOSE/CLOSEn periods ago Unlike other oscillators,momentum indicator doesn't have a 0 oscillation.Instead,it ranges between 99.4 to 100.6.This is an indication that the values of the momentum may move above or below 100. When the momentum moves above 100 then it means that the price is moving upwards while when the momentum moves below 100 then it means that the price is moving downwards.Therefore,this indicator can be used to signal the trader on when to enter a buy or a sell position.When the momentum moves below 100 from high then the trader should enter a sell position since the market will be moving downwards while when the momentum moves above 100 from low then the trader should enter a b